Platform
One workspace from live signal to KPI
Dashboards your engineers assemble. Trends that stream live and turn into statistics. Event timelines that drill to evidence. KPIs written as expressions, workspaces that keep every analysis, and administration you run yourself — one browser workspace on a historian that ships with the platform.
Dashboard builder
Dashboards your engineers assemble
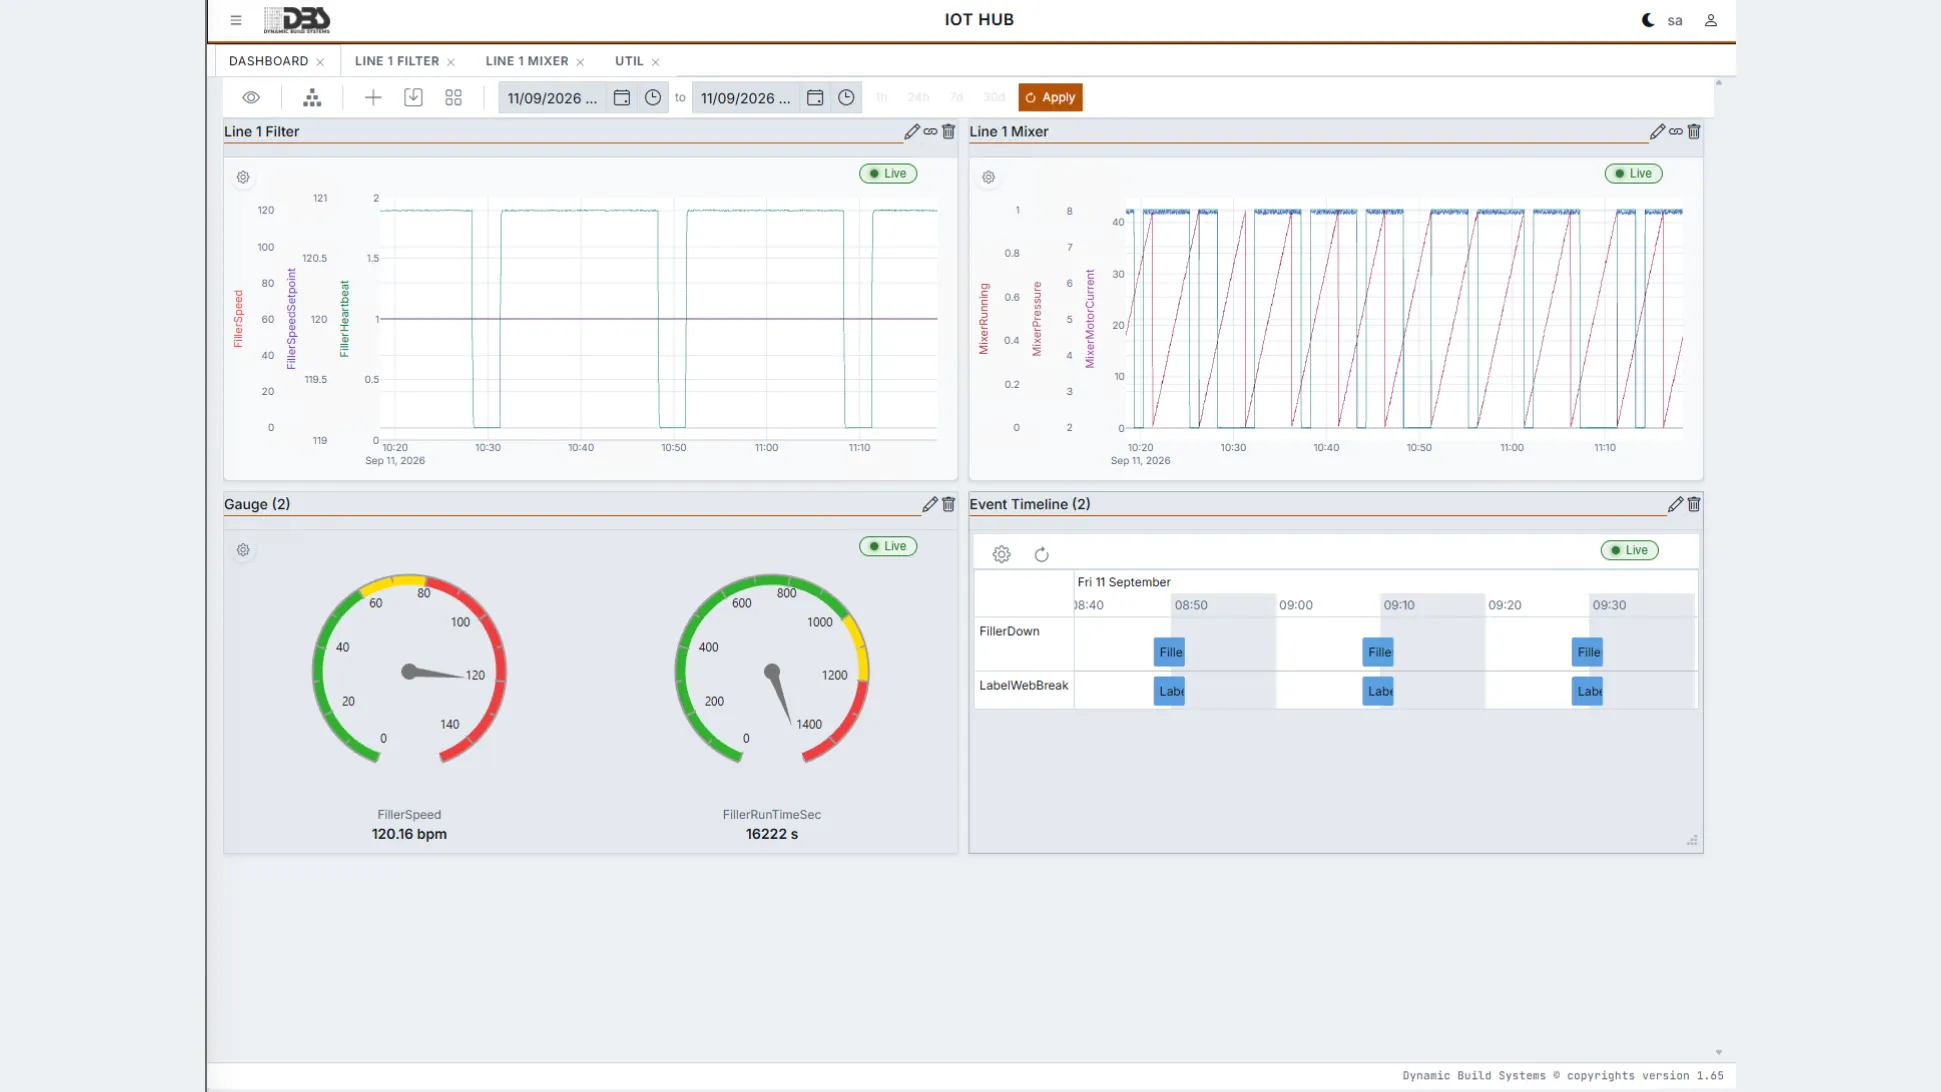
Assemble live operational dashboards by drag and drop — no developer, no downtime.
- NewEvent Property Chart panel
- NewShared preset gallery
- NewMy Trends tab
- NewNew Dashboard action
- Drag, resize and float 7 panel types on a configurable grid canvas: trend, KPI, circular gauge, linear gauge, event timeline, event log grid and the new event property chart.
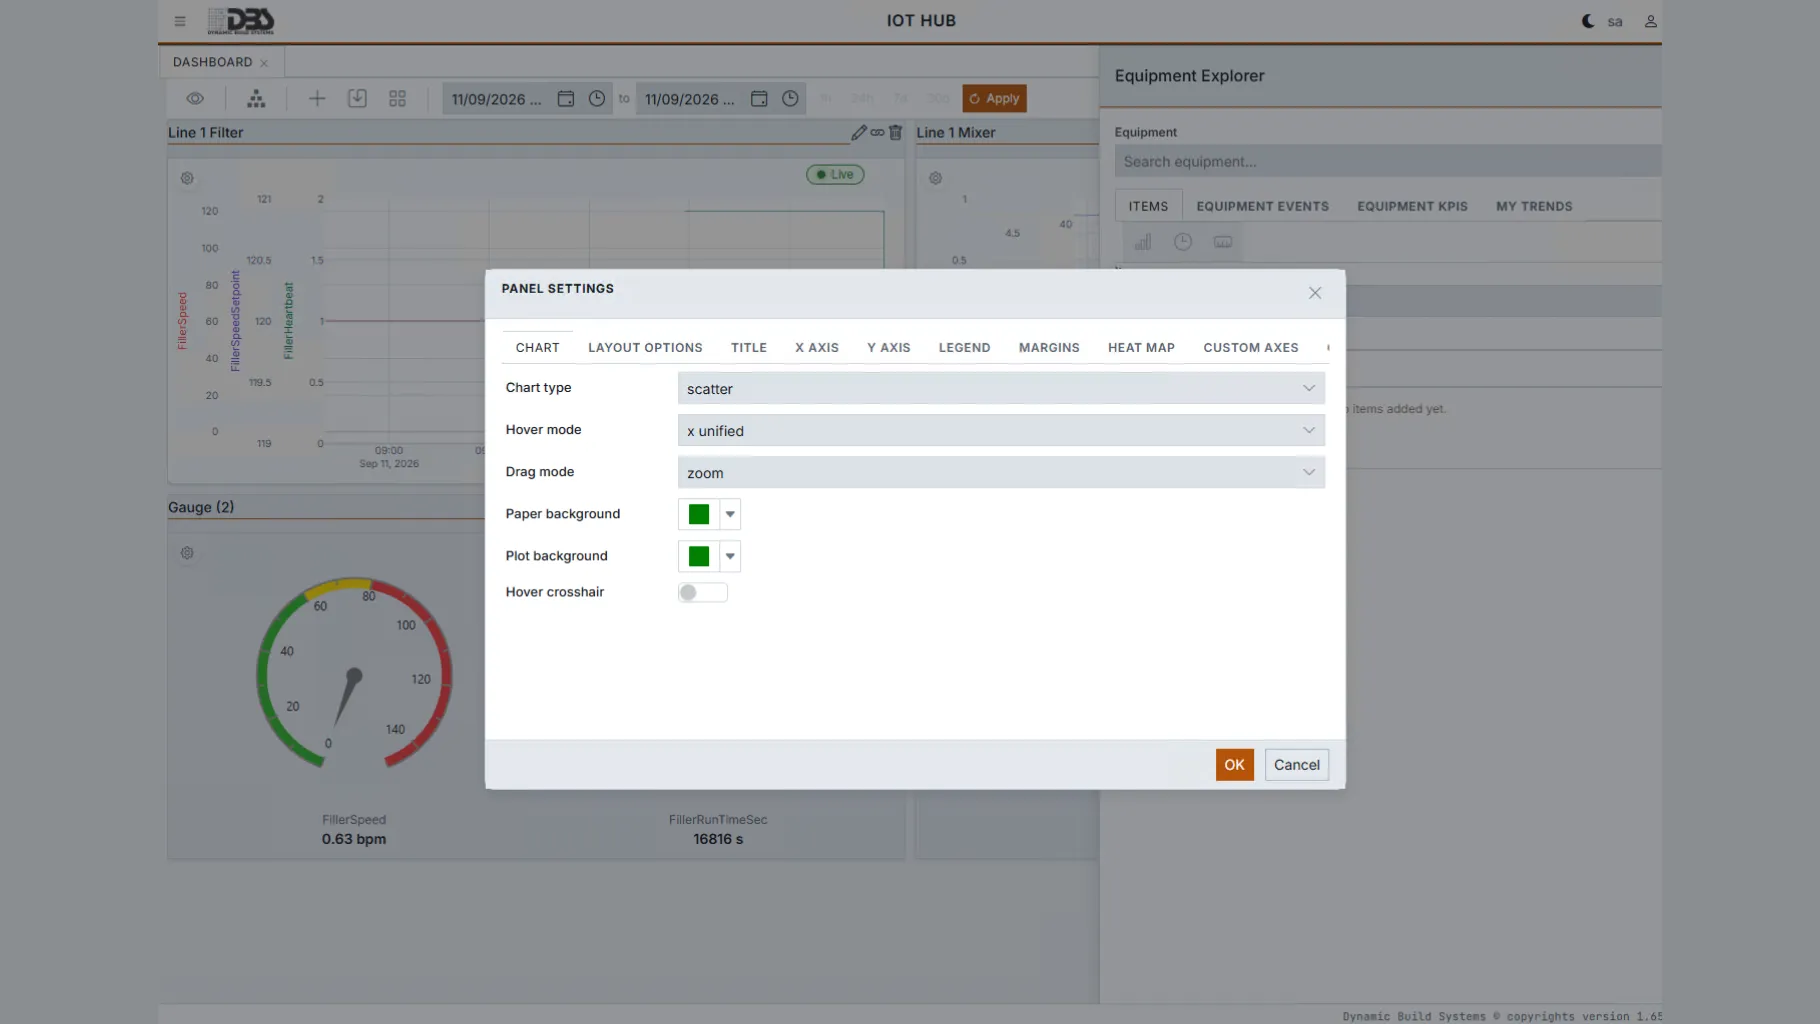
- Pick from 12 chart presets in one gallery shared across Trend, KPI and Event-Property targets, or take full control with 50+ trace types.
- Link a trend panel to an event timeline: selecting an event re-windows the trend automatically, so context is never lost.
- Build calculated traces from expressions that reference other traces — new series without coding or redeploying.
- Drop saved workspace trends straight onto a dashboard from the My Trends tab, or start clean with the New Dashboard action.
- Save, rename and share dashboards with everyone or keep them personal; 4 date-range presets (1h/24h/7d/30d) keep every view consistent.
- 7dashboard panel types
- 12chart presets
- 50+chart trace types
- 4date-range presets
Trends
Trends and live analysis
Move from live plant signal to statistical insight in a single trend workspace.
- NewUser-defined Y-axis titles
- NewPlant-vs-server time-zone model
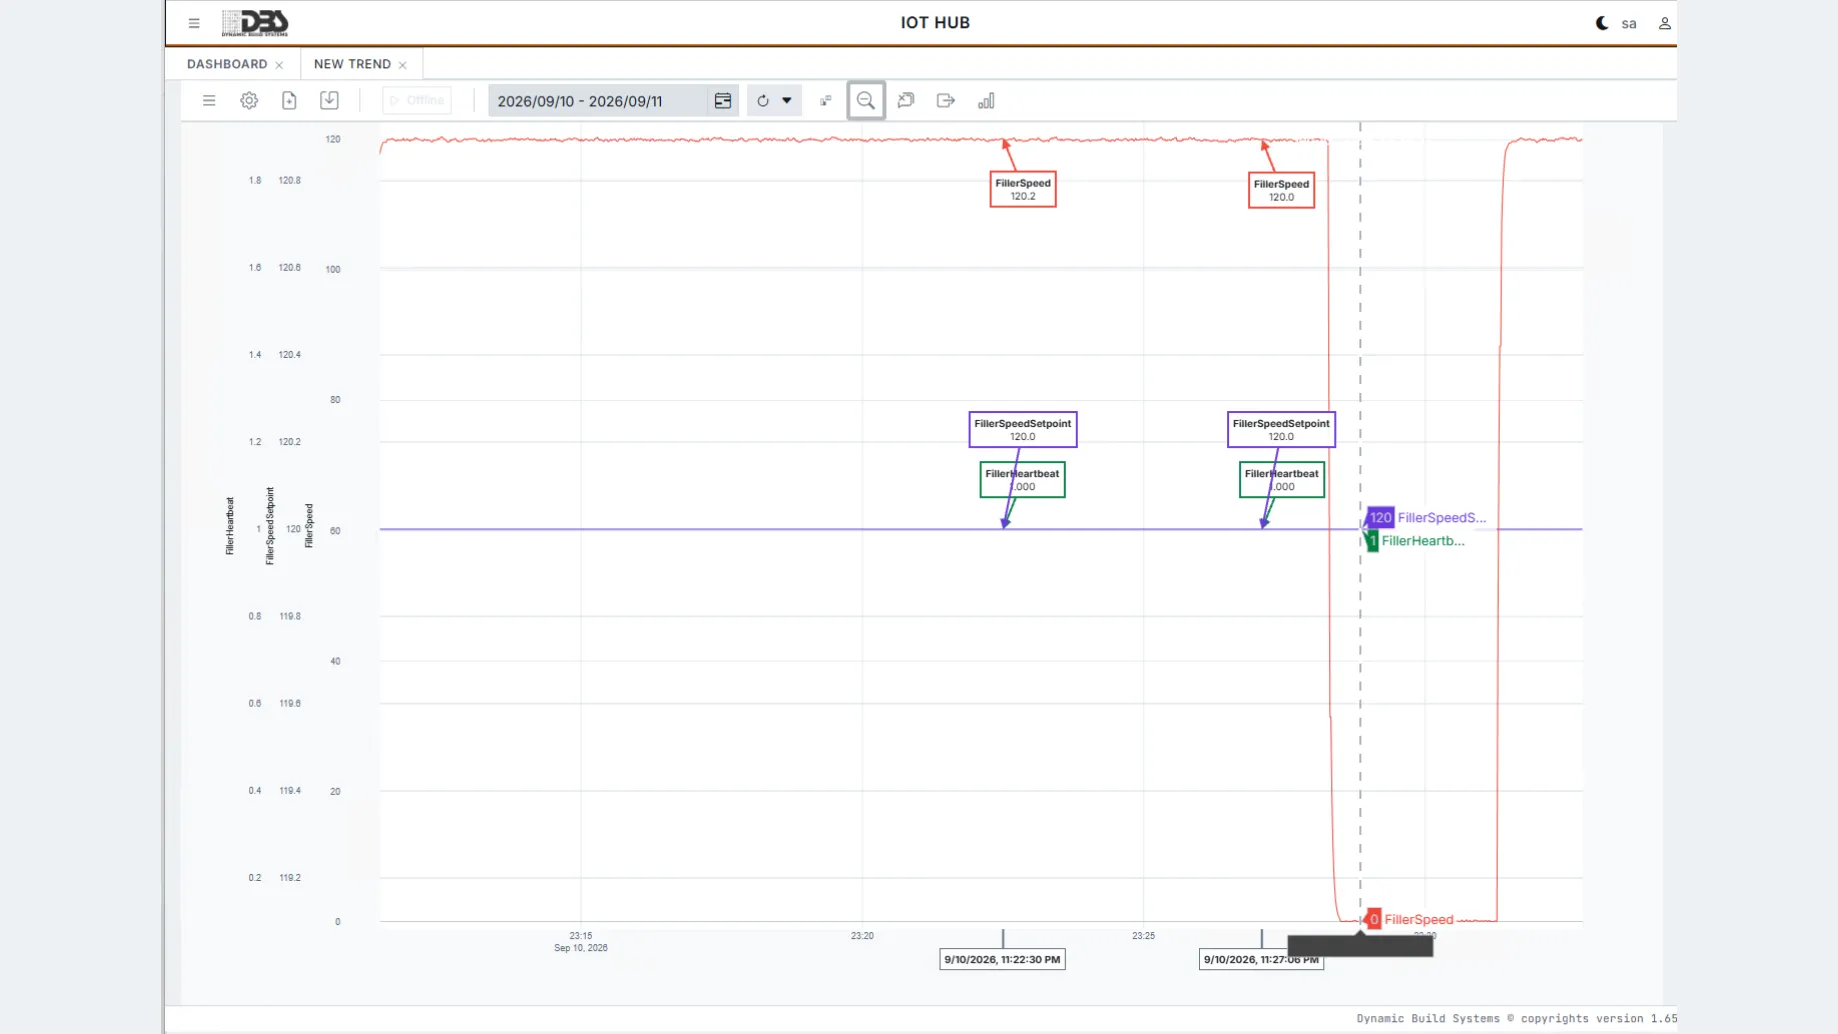
- Toggle Live and watch samples stream in under a pulsing LIVE indicator — one shared live stream per item serves every open panel, with no duplicate subscriptions.
- Zoom, pan, box-select and drop crosshair annotations with per-trace labels across up to 13 Y-axes, each with its own user-defined title.
- Pick a window from the 1–48h quick-range menu, or overlay several event windows side by side for comparison.
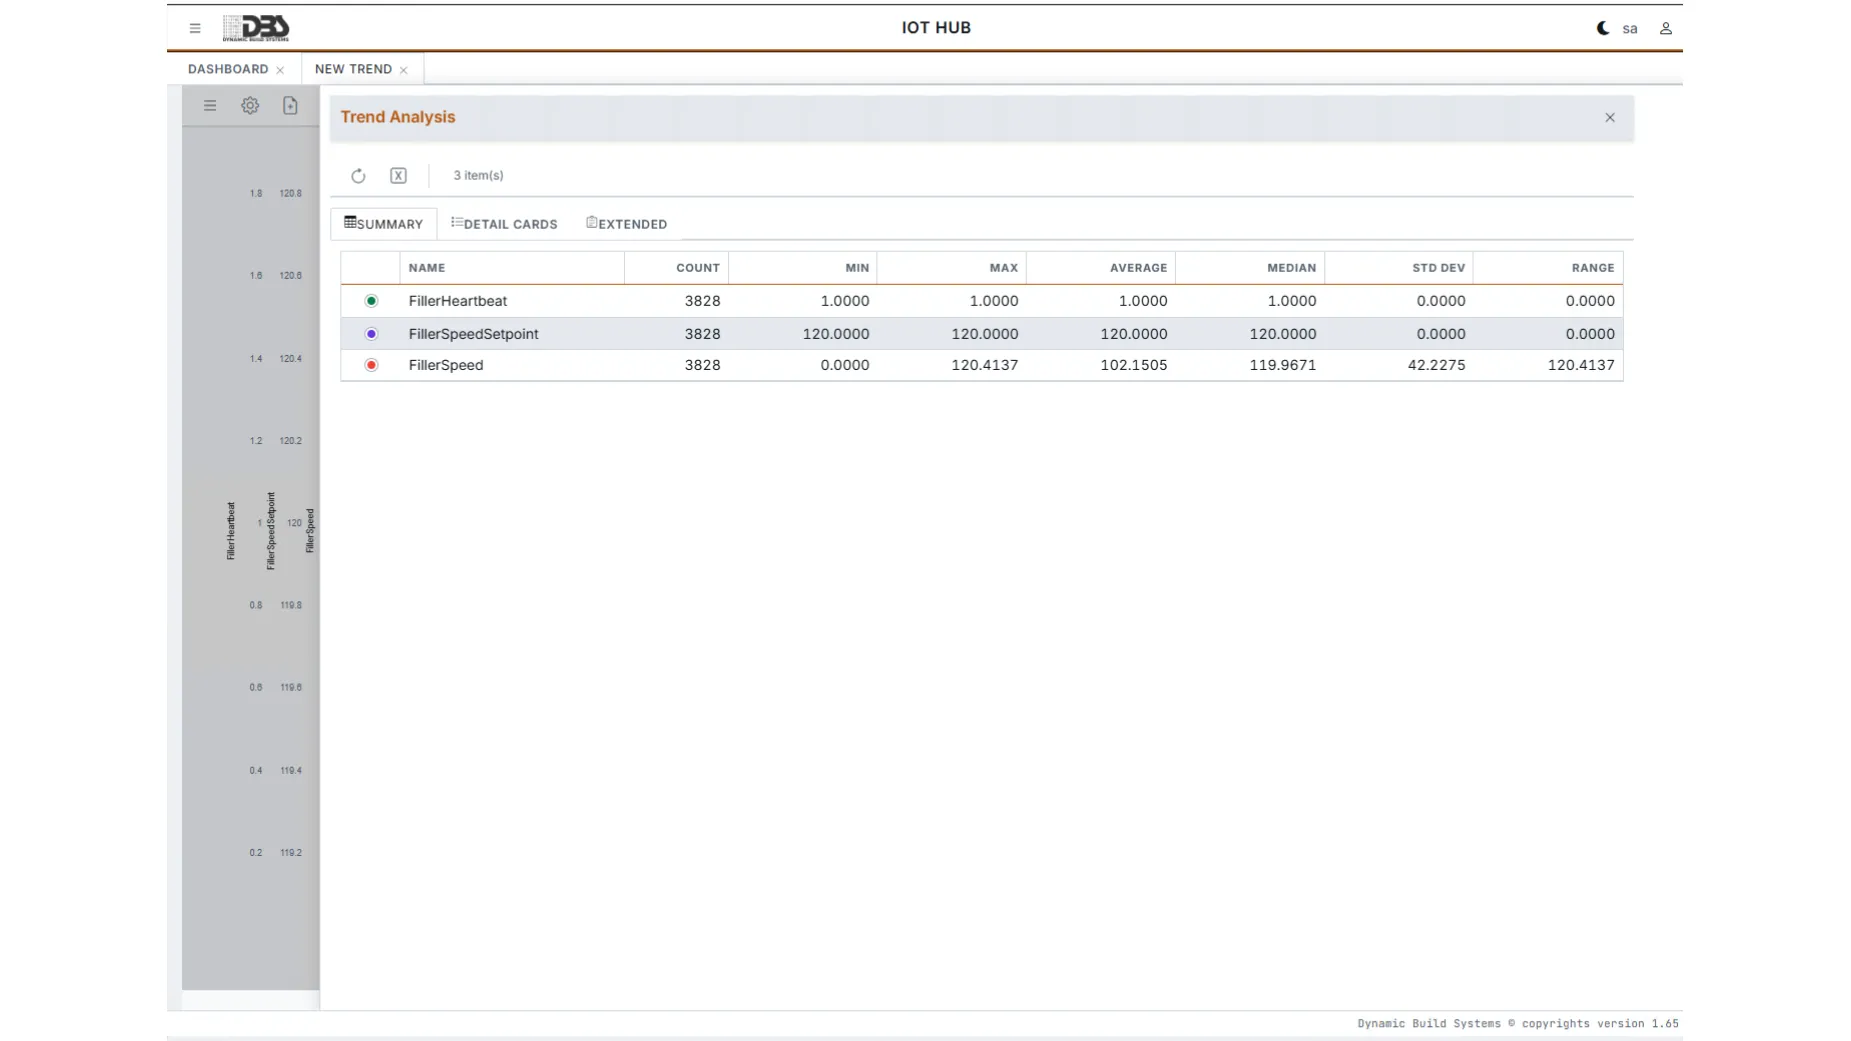
- Generate 19 statistics per trace — from min/max with timestamps to quartiles, skewness, kurtosis and RMS — without a spreadsheet round-trip.
- Read every timestamp in plant time or server time: the plant-vs-server time-zone model applies DST-aware conversion consistently across trends, dashboards, timelines and exports.
- Ask AI about the visible trend straight from the chart, then export resampled data to Excel and chart images as 2560×1440 PNG.
- 19statistics per trace
- 13Y-axes per trend
- 2560×1440PNG chart export
- 1–48hquick-range menu
Events
Event timelines and equipment monitoring
See every equipment event on one timeline and drill from event to evidence in a click.
- NewEvent Property Chart panel
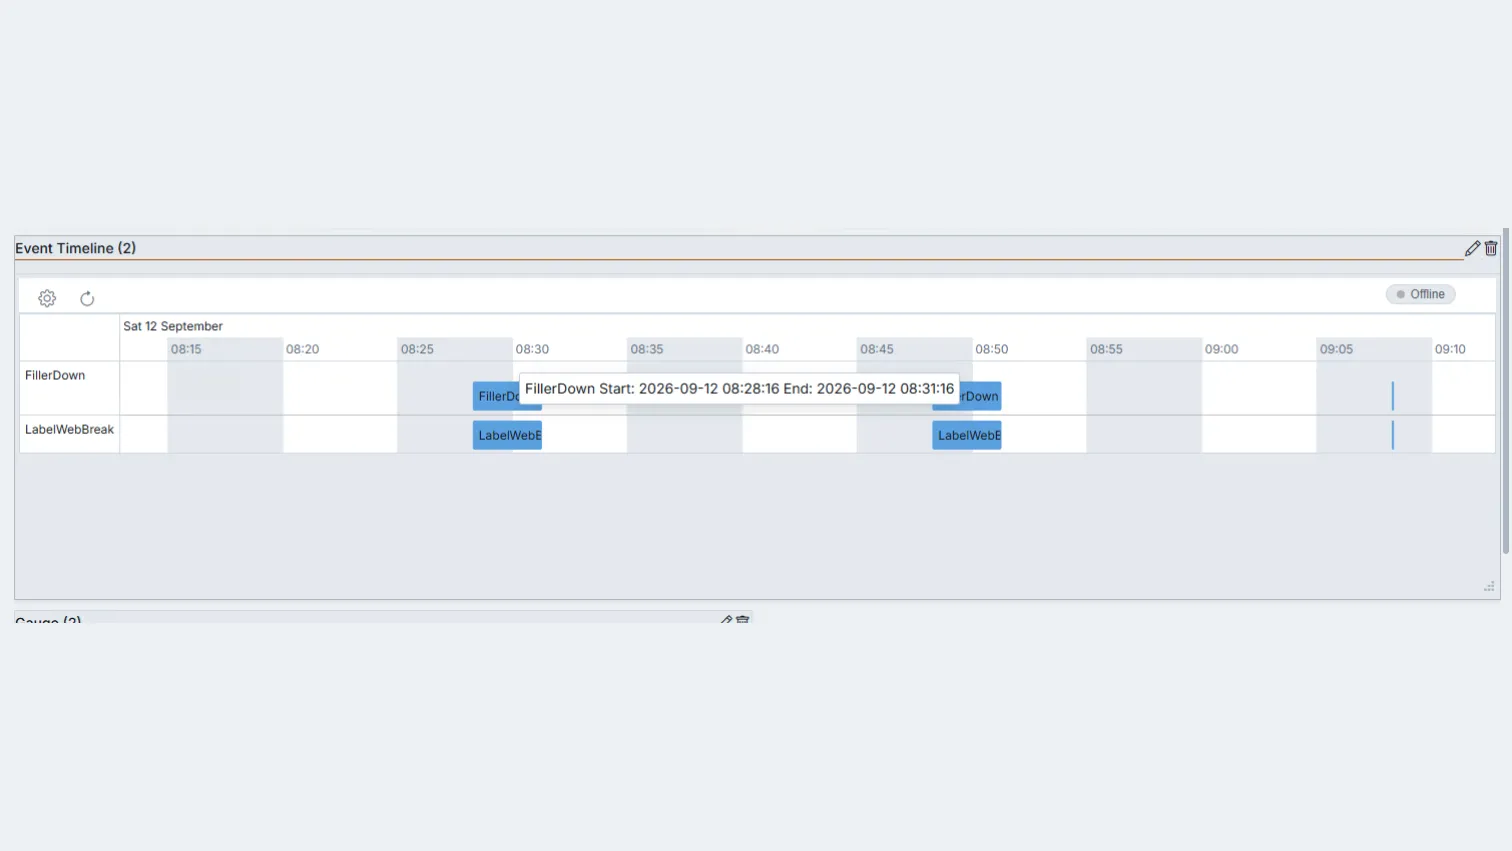
- Zoom and pan grouped timelines with an adaptive axis from 30 minutes to weekly, in 3 grouping modes (none, event, equipment) with overlapping runs stacked.
- Colour-code in-progress versus completed events, with per-equipment and per-event overrides.
- Click an event to drill into its trend and event-log details without losing process context.
- Compare selected events side by side from the Equipment Event Overview, then roll up from one machine to a whole section in the same surface.
- Chart event properties — stop duration by cause, for example — in the new Event Property Chart panel.
- Export pivoted event grids in 2 formats, Excel or PDF.
- 3timeline grouping modes
- 2export formats (Excel, PDF)
KPI engine
KPI and event engine
Author KPIs and alarm logic as plain expressions — change plant calculations without a redeploy.
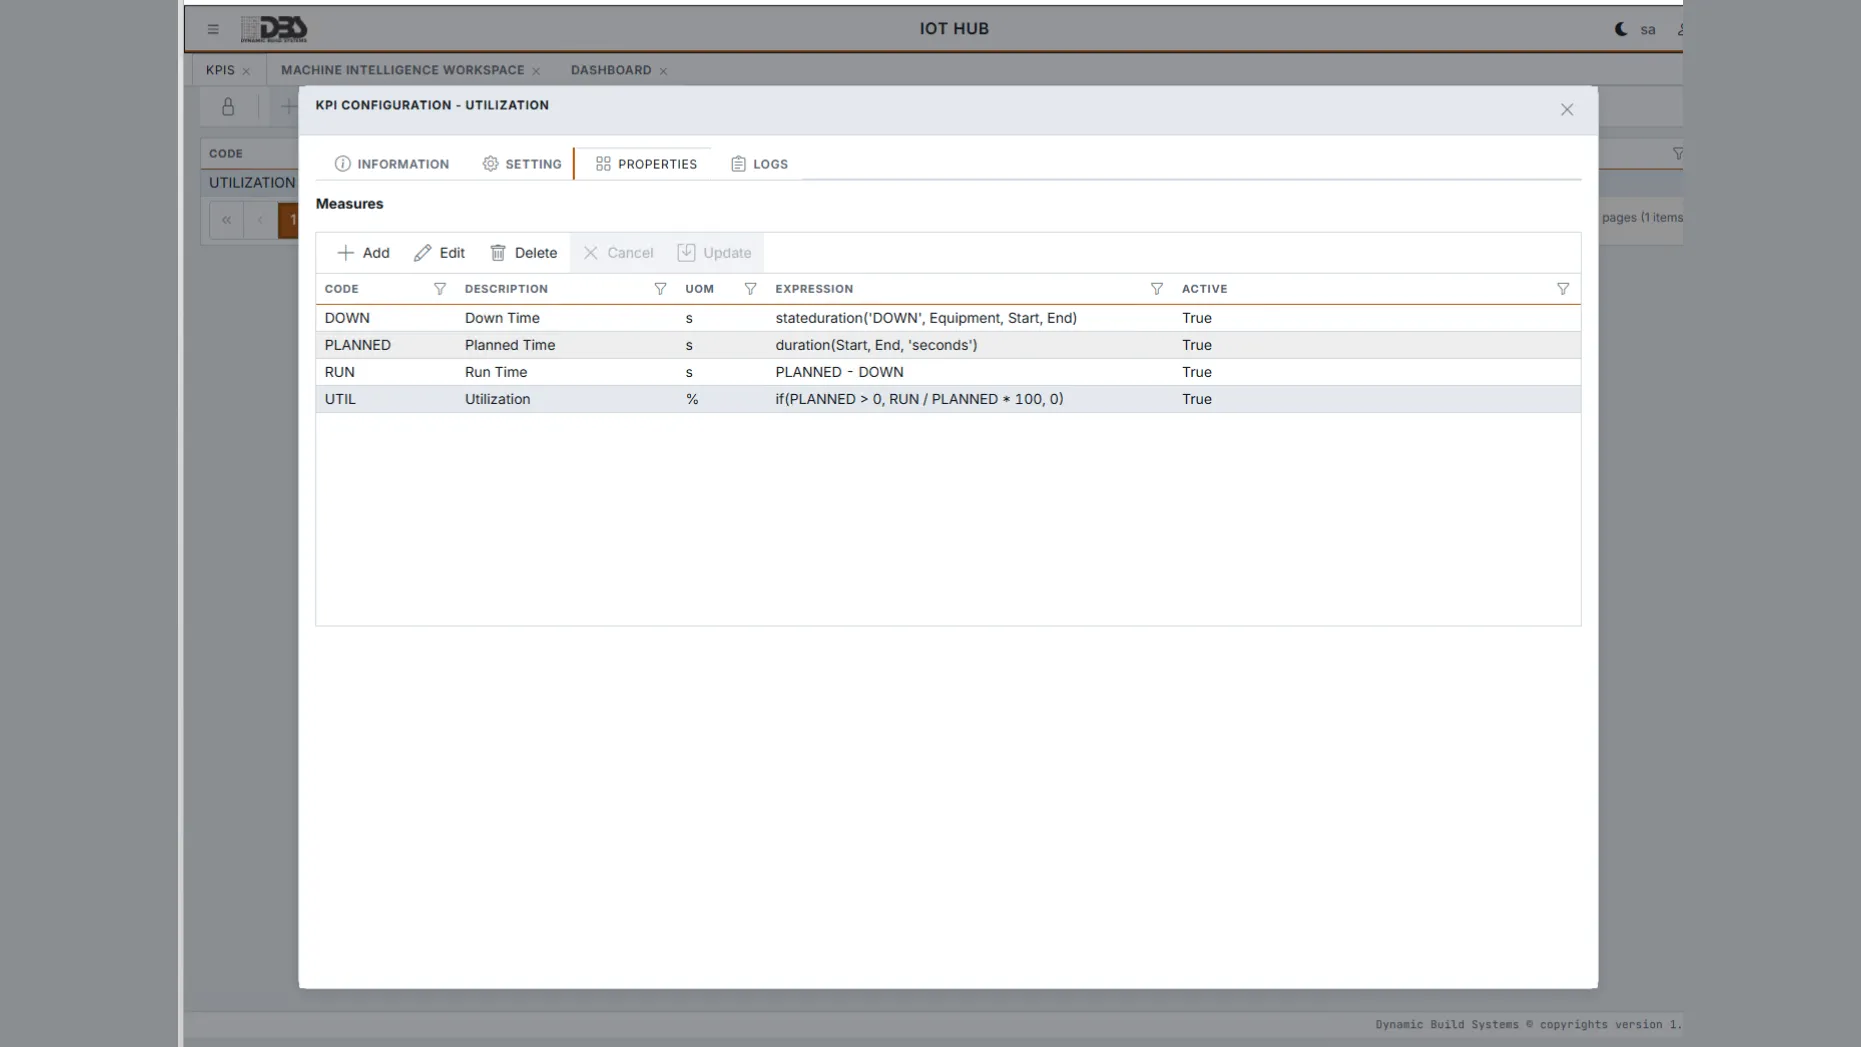
- Define KPIs and event trigger/reset logic as text expressions — 0 code redeploys to change a calculation.
- Call 40+ domain functions: historian aggregates, state durations, signal maths, bit decoding and time helpers.
- Fire actions from events: SMS, email, API calls and stored procedures.
- Evaluate KPIs per equipment, measure and shift with actual-versus-target logging, and watch calculation progress stream live.
- Re-extract event logs over any historical range on demand; results land straight in dashboard KPI panels.
- 40+expression functions
- 0redeploys to change a KPI
// Event trigger — unplanned stop: mill drive idle for
// over 2 minutes while scheduled to run
if(
  stateduration(
    'Stopped',
    'Mill3',
    preveventstart('Shift', 'Mill3', currenttimestamp()),
    currenttimestamp()
  ) > 120
  && hiscalcmax(
    'Mill3.Motor.Current',
    preveventstart('Shift', 'Mill3', currenttimestamp()),
    currenttimestamp()
  ) > 5,
  1,
  0
)

// Event reset — drive back above 80 % of the shift's
// peak current
if(
  rateofchangets(
    0.8 * hiscalcmax(
      'Mill3.Motor.Current',
      preveventstart('Shift', 'Mill3', currenttimestamp()),
      currenttimestamp()
    ),
    'Mill3.Motor.Current',
    preveventstart('Shift', 'Mill3', currenttimestamp()),
    currenttimestamp()
  ) > 0,
  1,
  0
)

// KPI — availability (%) for the current shift:
// running time over scheduled time
100
  * stateduration(
      'Running',
      'Mill3',
      preveventstart('Shift', 'Mill3', currenttimestamp()),
      currenttimestamp()
    )
  / stateduration(
      'Scheduled',
      'Mill3',
      preveventstart('Shift', 'Mill3', currenttimestamp()),
      currenttimestamp()
    )

// KPI — tonnes fed this shift
// (feed rate integrated over the shift, t/h -> t)
integrator(
  'Mill3.Feed.Rate',
  preveventstart('Shift', 'Mill3', currenttimestamp()),
  currenttimestamp()
) / 3600

// KPI — mean feed rate this shift
hiscalcavg(
  'Mill3.Feed.Rate',
  preveventstart('Shift', 'Mill3', currenttimestamp()),
  currenttimestamp()
)Workspaces
Workspaces and collaboration
Organise, share and revisit analysis — every trend and dashboard saved per user, shareable on demand.
- NewMy Trends tab
- Organise trends and workspaces in a folder tree with drag-and-drop.
- Share a trend to the Shared Trends folder — read-only for colleagues, so the author’s analysis stays intact.
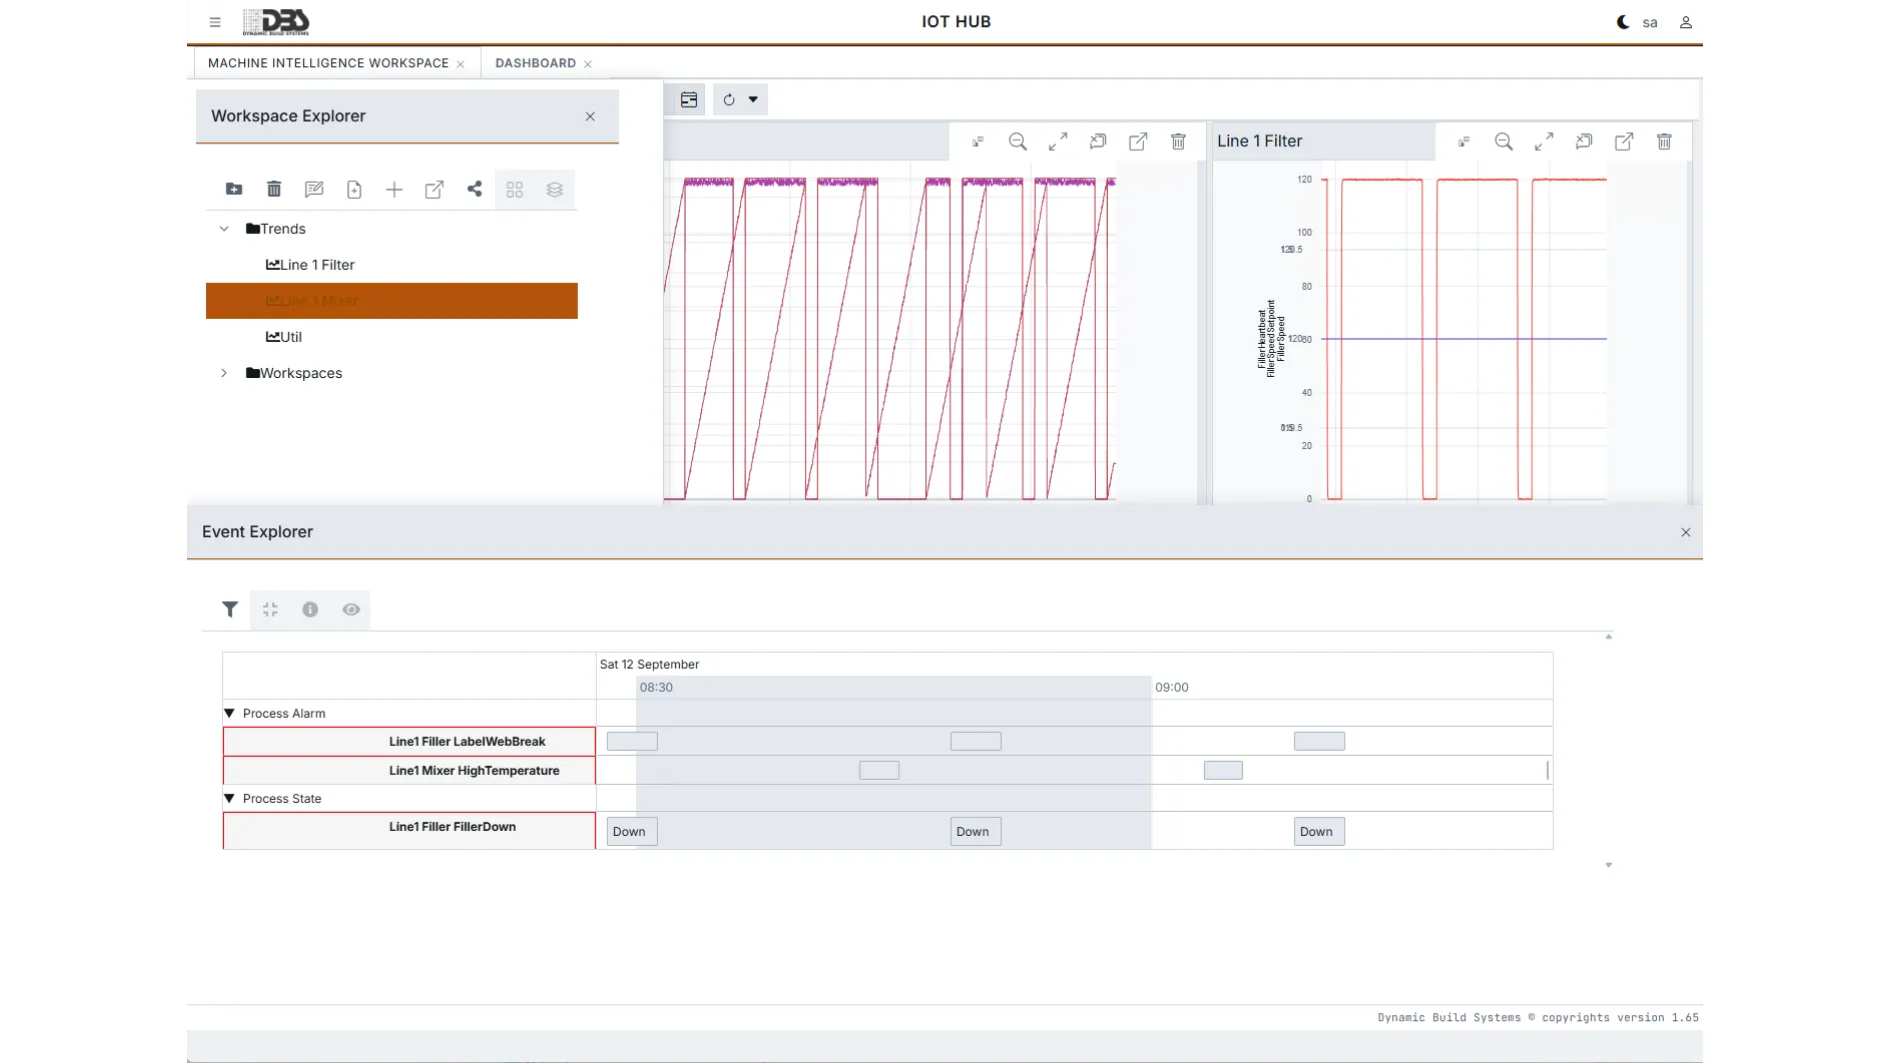
- Open a workspace in either of 2 analysis modes: Trend or Event Comparison.
- Overlay equipment events onto saved trends in the Multi-Instrument Workspace, turning a trend into an investigation surface.
- Drop any saved trend onto a dashboard from the My Trends tab, or open it in a new browser tab for multi-screen operation.
- 2workspace analysis modes
Administration
Administration and configuration
Configure the entire platform — users, equipment, tags, KPIs — through self-service editors, no vendor ticket required.
- NewHub Management
- NewExcel bulk item import
- Manage users and 3 access roles (Admin, User, Viewer) alongside native and Microsoft Entra ID sign-in.
- Configure equipment, events and properties, devices, tags, MQTT topics and items in 12 consistent list-and-detail editors.
- Author KPI and event expressions in an IDE-grade editor with autocomplete over the 40+ function catalogue and per-equipment tag suggestions.
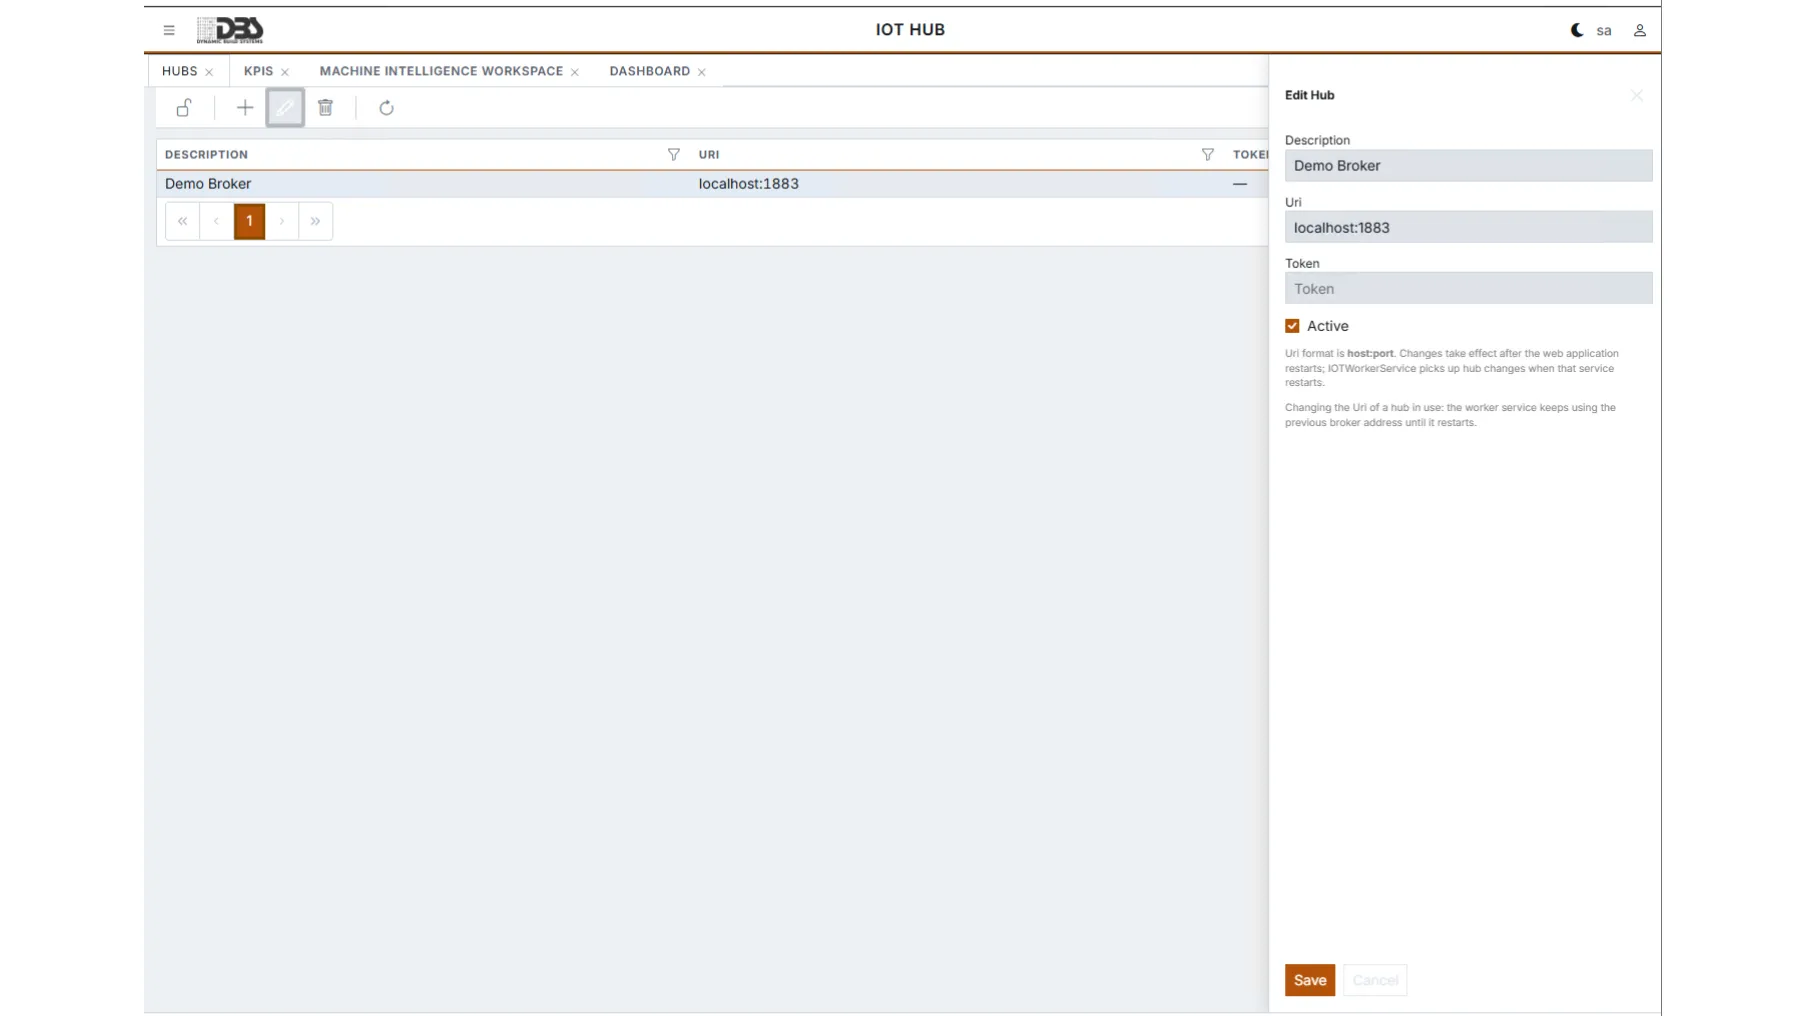
- Add, edit and delete MQTT hub instances in Hub Management, with URI validation before anything is saved.
- Bulk-import items from Excel with a colour-coded Create / Update / Conflict / Unchanged / Error preview and a chunked, verified save.
- Model shifts and operating states with Time Models and State Machines, and navigate the whole plant model in the Solution Browser.
The web portal appears in-app under the title IOT Hub.
- 12configuration editors
- 40+expression functions
- 3access roles
Built for
Who gets what from one workspace
Vertical plant analytics — deeper, not broader. You don't build a plant solution on DynamicPlantMesh; you configure one.
Plant and production manager
Live dashboards of the KPIs that matter this shift, actual versus target logged per equipment, measure and shift, and one timeline that answers how long, how often and what it looked like last time.
Process and reliability engineer
Trends with 19 statistics per trace, crosshair annotations and event overlays on long, fine-grained history — show me this pump's vibration during the same shift last quarter — plus Ask AI grounded in the live historian.
Operations
Saved trends and read-only shared analysis in workspaces, and event timelines that drill from event to trend and log evidence in a click, so a shift handover is a link, not a retelling.
IT and OT integrator
Self-service editors for users, roles, equipment, tags and MQTT topics, KPI maths changed in configuration with 0 redeploys, and an on-premise, data-sovereign deployment that needs no container orchestration team.
Configure a plant solution — don't build one.
Configure a first area on the OPC-UA, OPC classic DA and MQTT equipment you have today — and bring the KPI your engineers would change first.